Python程序设计-大作业
1. 作业题目
1.1 数据
gpw-v4-population-count-rev11_2020_30_sec_asc.zip 是一个全球人口分布数据压缩文件,解压后包括了8个主要的 .asc 后缀文件,它们是全球网格化的人口分布数据文件,这些文件分别是:
gpw-v4-population-count-rev11_2020_30_sec_1.ascgpw-v4-population-count-rev11_2020_30_sec_2.ascgpw-v4-population-count-rev11_2020_30_sec_3.ascgpw-v4-population-count-rev11_2020_30_sec_4.ascgpw-v4-population-count-rev11_2020_30_sec_5.ascgpw-v4-population-count-rev11_2020_30_sec_6.ascgpw-v4-population-count-rev11_2020_30_sec_7.ascgpw-v4-population-count-rev11_2020_30_sec_8.asc
这些文件分别对应地球不同经纬度的范围。

压缩文件下载网页:
https://sedac.ciesin.columbia.edu/data/set/gpw-v4-population-count-rev11/data-download
1.1.2 服务端
压缩文件(gpw-v4-population-count-rev11_2020_30_sec_asc.zip)是一个全球人口分布数据。基于 Sanic 实现一个查询服务,服务包括:
- 按给定的经纬度范围查询人口总数,查询结果采用 JSON 格式。
- 不可以采用数据库,只允许使用文件方式存储数据。
- 可以对现有数据进行整理以便加快查询速度,尽量提高查询速度。
查询参数格式
采用 GeoJSON(https://geojson.org/)的多边形格式(每次只需要查询一个多边形范围,只需要支持凸多边形)。
1.1.3 客户端
针对上面的查询服务,实现一个服务查询客户端,数据获取后使用 Matplotlib 散点图(Scatter)进行绘制。
- 横坐标(x轴)为经度。
- 纵坐标(y轴)为纬度。
2. 服务端代码
preprocess.py
import numpy as np
from pathlib import Path
import json
import logging

class GridSlicer:
    def __init__(self, block_size=60):
        self.block_size = block_size
        self.logger = logging.getLogger(__name__)

    def read_asc_header(self, filename):
        header = {}
        with open(filename) as f:
            header['ncols'] = int(f.readline().split()[1])
            header['nrows'] = int(f.readline().split()[1])
            header['xllcorner'] = float(f.readline().split()[1])
            header['yllcorner'] = float(f.readline().split()[1])
            header['cellsize'] = float(f.readline().split()[1])
            header['NODATA_value'] = float(f.readline().split()[1])
        return header

    def slice_file(self, input_file):
        self.logger.info(f"Processing {input_file}")
        header = self.read_asc_header(input_file)
        base_name = Path(input_file).stem


        out_dir = Path(input_file).parent / f"{base_name}_blocks"
        out_dir.mkdir(parents=True, exist_ok=True)

        data = np.loadtxt(input_file, skiprows=6)
        rows, cols = data.shape

        blocks_info = []

        # 切分数据块
        for i in range(0, rows, self.block_size):
            for j in range(0, cols, self.block_size):
                block_data = data[i:i+self.block_size, j:j+self.block_size]
                if block_data.size == 0:
                    continue

                # 计算新块的地理范围
                block_header = header.copy()
                block_header['nrows'] = block_data.shape[0]
                block_header['ncols'] = block_data.shape[1]
                block_header['xllcorner'] = header['xllcorner'] + j * header['cellsize']
                block_header['yllcorner'] = header['yllcorner'] + (rows - (i + block_data.shape[0])) * header['cellsize']

                # 生成输出文件名
                out_filename = f"{base_name}_block_{i}_{j}.npy"
                out_path = out_dir / out_filename

                # 保存NPY文件
                np.save(out_path, block_data)

                # 记录块信息 (添加header信息)
                blocks_info.append({
                    'filename': str(out_filename),
                    'header': block_header,
                    'bounds': {
                        'north': block_header['yllcorner'] + block_data.shape[0] * header['cellsize'],
                        'south': block_header['yllcorner'],
                        'east': block_header['xllcorner'] + block_data.shape[1] * header['cellsize'],
                        'west': block_header['xllcorner']
                    }
                })

        # 保存索引文件
        index_path = out_dir / f"{base_name}_index.json"
        with open(index_path, 'w') as f:
            json.dump(blocks_info, f, indent=2)

        return str(out_dir)


logging.basicConfig(level=logging.INFO)

input_files = [
    'population/gpw_v4_population_count_rev11_2020_30_sec_1.asc',
    'population/gpw_v4_population_count_rev11_2020_30_sec_2.asc',
    'population/gpw_v4_population_count_rev11_2020_30_sec_3.asc',
    'population/gpw_v4_population_count_rev11_2020_30_sec_4.asc',
    'population/gpw_v4_population_count_rev11_2020_30_sec_5.asc',
    'population/gpw_v4_population_count_rev11_2020_30_sec_6.asc',
    'population/gpw_v4_population_count_rev11_2020_30_sec_7.asc',
    'population/gpw_v4_population_count_rev11_2020_30_sec_8.asc'
]

def main():
    slicer = GridSlicer(block_size=600)
    for input_file in input_files:
        output_dir = slicer.slice_file(input_file)
        print(f"Processed {input_file} -> {output_dir}")

if __name__ == '__main__':
    main()
app.py
from sanic import Sanic, response
from sanic.response import json
from shapely.geometry import Polygon, box, Point
import numpy as np
from pathlib import Path
import json as jsonlib
import logging

app = Sanic("population_query")
logging.basicConfig(level=logging.INFO)
logger = logging.getLogger(__name__)

class PopulationQueryService:
    def __init__(self):
        self.blocks_info = {}
        self._load_indices()
        self.base_gsize = 150
        self.gsize = self.base_gsize

    def _load_indices(self):
        """加载所有索引文件"""
        base_dir = Path('population')
        for index_file in base_dir.glob('*/*_index.json'):
            with open(index_file) as f:
                region_blocks = jsonlib.load(f)
                self.blocks_info[index_file.parent.name] = region_blocks

        logger.info(f"Loaded indices from {len(self.blocks_info)} regions")

    def _find_intersecting_blocks(self, polygon: Polygon):
        """找出与多边形相交的数据块"""
        intersecting_blocks = []
        poly_bounds = polygon.bounds

        for region, blocks in self.blocks_info.items():
            for block in blocks:
                block_box = box(
                    block['bounds']['west'],
                    block['bounds']['south'],
                    block['bounds']['east'],
                    block['bounds']['north']
                )
                if block_box.intersects(polygon):
                    block['region'] = region
                    intersecting_blocks.append(block)

        return intersecting_blocks

    def _get_population_grid(self, polygon: Polygon, grid_size=150):
        """计算网格人口分布"""
        # 获取相交的block
        blocks = self._find_intersecting_blocks(polygon)
        minx, miny, maxx, maxy = polygon.bounds
        cellsize = blocks[0]['header']['cellsize']
        # 根据多边形范围选择合适的grid_size(1 ~ self.base_gsize)
        grid_size = min(int(round(min((maxx - minx) / cellsize, (maxy - miny) / cellsize))), grid_size)

        x_step = (maxx - minx) / grid_size
        y_step = (maxy - miny) / grid_size

        population_grid = np.zeros((grid_size, grid_size))

        # 遍历每个网格
        for i in range(grid_size):
            for j in range(grid_size):
                # 计算当前网格的边界
                cell_minx = minx + j * x_step
                cell_maxx = cell_minx + x_step
                cell_miny = miny + i * y_step
                cell_maxy = cell_miny + y_step

                grid_cell = box(cell_minx, cell_miny, cell_maxx, cell_maxy)

                if not polygon.intersects(grid_cell):
                    population_grid[i, j] = -1  # 标记多边形外的网格
                    continue

                # 计算该网格的总人口
                cell_population = 0
                for block in blocks:
                    block_box = box(
                        block['bounds']['west'],
                        block['bounds']['south'],
                        block['bounds']['east'],
                        block['bounds']['north']
                    )

                    if block_box.intersects(grid_cell):
                        filepath = Path('population') / block['region'] / block['filename']
                        block_data = np.load(filepath)

                        # 计算重叠区域
                        overlap_minx = max(cell_minx, block['bounds']['west'])
                        overlap_maxx = min(cell_maxx, block['bounds']['east'])
                        overlap_miny = max(cell_miny, block['bounds']['south'])
                        overlap_maxy = min(cell_maxy, block['bounds']['north'])

                        # 计算在block中的像素索引
                        cellsize = block['header']['cellsize']
                        start_x = int(round((overlap_minx - block['bounds']['west']) / cellsize))
                        end_x = int(round((overlap_maxx - block['bounds']['west']) / cellsize)) - 1
                        # y轴方向是从北向南
                        start_y = block_data.shape[0] - int(round((overlap_maxy - block['bounds']['south']) / cellsize))
                        end_y = block_data.shape[0] - int(round((overlap_miny - block['bounds']['south']) / cellsize)) - 1

                        # 确保索引在有效范围内
                        start_x = max(0, min(start_x, block_data.shape[1]-1))
                        end_x = max(0, min(end_x, block_data.shape[1]-1))
                        start_y = max(0, min(start_y, block_data.shape[0]-1))
                        end_y = max(0, min(end_y, block_data.shape[0]-1))

                        if start_x <= end_x and start_y <= end_y:
                            # 累加重叠区域的人口
                            overlap_data = block_data[start_y:end_y+1, start_x:end_x+1]
                            cell_population += np.sum(overlap_data[overlap_data >= 0])

                population_grid[i, j] = cell_population

        population_grid = np.around(population_grid).astype(int) # 对人口数取整

        return {
            'grid': population_grid.tolist(),
            'bounds': {
                'minx': minx,
                'miny': miny,
                'maxx': maxx,
                'maxy': maxy
            },
            'grid_size': grid_size
        }, grid_size # 此处将最终使用的grid_size一并返回

    async def query_population(self, geojson_data: dict):
        """查询指定多边形范围内的人口分布"""
        try:
            coords = geojson_data['coordinates'][0]
            polygon = Polygon(coords)

            # 计算网格人口分布
            grid_data, self.gsize = self._get_population_grid(polygon, grid_size=self.base_gsize)

            # 计算总人口(排除多边形外的点)
            valid_cells = np.array(grid_data['grid']) >= 0
            total_population = int(round(np.sum(np.array(grid_data['grid'])[valid_cells])))
            return {
                'status': 'success',
                'total_population': total_population,
                'grid_data': grid_data,
                'grid_size': self.gsize
            }

        except Exception as e:
            logger.error(f"Query error: {str(e)}")
            return {'status': 'error', 'message': str(e)}

# 创建服务实例
query_service = PopulationQueryService()

@app.route('/query_population', methods=['POST'])
async def handle_query(request):
    """处理人口查询请求"""
    try:
        geojson_data = request.json
        if geojson_data.get('type') != 'Polygon':
            return json({'error': 'Invalid GeoJSON: must be a Polygon'}, status=400)

        result = await query_service.query_population(geojson_data)
        return json(result)

    except Exception as e:
        logger.error(f"Request handling error: {str(e)}")
        return json({'error': str(e)}, status=500)

if __name__ == '__main__':
    app.run(host='0.0.0.0', port=8848, debug=True)
2.1 代码说明
2.1.1 预处理脚本
由于gpw-v4-population-count-rev11_2020_30_sec_asc数据集的规模巨大,直接将原文件读入内存不仅极为耗时,还会浪费大量的内存空间,因此我编写了一个预处理脚本preprocess.py来对数据集文件进行预处理。
脚本会将每一个asc文件划分为行(即 )的小块,并针对每一个大asc文件创建一个子目录,使用更加紧凑的二进制格式.npy将小块存储,便于numpy模块直接读取。同时,还会在每一个子目录下创建一个json索引,用于存放每个块的header信息以及文件名索引。
block的文件名被命名为gpw_v4_population_count_rev11_2020_30_sec_X_block_i_j.npy,其中i, j分别对应起始行数列数在原文件中的位置。preprocess.py脚本会从population目录中读取数据集,并按上述方法依次处理八个asc文件。
通过这种方式,大幅优化了后端的读取和查询速度。
2.1.2 查询服务
在后端程序app.py中,我设计了一个查询服务类PopulationQueryService,用于处理人口查询服务。它加载人口数据索引文件,计算指定多边形范围内的人口分布,并返回结果。
为了降低前后端之间的通信负担以及不太必要的计算,我将用户指定的多边形构成的方形边界进行分割成网格,长宽各均匀地分成grid_size份(在我的代码中取值范围为1-150),最终返回的是一个的二维数组,数组的内容是每一个grid中的人口总数。返回的数据中只会包含多边形范围内的人口数据,其他无效位置的数据使用-1来进行填充。
方法
-
_load_indices(self)加载所有索引文件,将索引信息存储在
self.blocks_info中。 -
_find_intersecting_blocks(self, polygon: Polygon) -> list找出与指定多边形相交的数据块。
-
参数:
polygon(Polygon): 查询的多边形范围
-
返回:
intersecting_blocks(list): 与多边形相交的数据块列表
-
-
_get_population_grid(self, polygon: Polygon, grid_size=150) -> tuple计算指定多边形范围内的网格人口分布。
-
参数:
polygon(Polygon): 查询的多边形范围grid_size(int): 基准网格大小,默认为150
-
返回:
grid_data(dict): 包含人口分布的网格数据和边界信息grid_size(int): 最终实际使用的网格大小
这里传入的
grid_size不一定是最终实际采用的grid_size。由于我们的数据分辨率为30角秒,当目标区域过小时()时,数据不能满足我们的划分,因此选择min(int(round(min((maxx - minx) / cellsize, (maxy - miny) / cellsize))), grid_size)来作为最终的grid_size。_get_population_grid首先会调用_find_intersecting_blocks方法获取相交的数据块,然后对每一个grid,计算grid与数据块的相交部分并统计在grid内的人口,依次遍历后获取按网格划分的人口分布并返回。 -
-
query_population(self, geojson_data: dict) -> dict查询指定多边形范围内的人口分布。
-
参数:
geojson_data(dict): 包含查询多边形的GeoJSON数据
-
返回:
result(dict): 查询结果,包括总人口数、网格数据和网格大小
-
2.1.3 API
POST /query_population
请求格式:
-
URL:
/query_population -
方法:
POST -
请求头:
Content-Type: application/json -
请求体示例:
{
    "type": "Polygon",
    "coordinates": [
        [
            [lng1, lat1],
            [lng2, lat2],
            [lng3, lat3],
            [lng4, lat4],
            [lng1, lat1]
        ]
    ]
}
响应格式:
-
状态码:
200 OK -
响应头:
Content-Type: application/json -
响应体示例:
{
    "status": "success",
    "total_population": 123456,
    "grid_data": {
        "grid": [[0, 1, 2], [3, 4, 5], [6, 7, 8]],
        "bounds": {
            "minx": -180,
            "miny": -90,
            "maxx": 180,
            "maxy": 90
        }
    },
    "grid_size": 3
}
错误响应:
-
状态码:
400 Bad Request -
响应体示例:
{ "error": "Invalid GeoJSON: must be a Polygon" } -
状态码:
500 Internal Server Error -
响应体示例:
{
	"error": "'NoneType' object has no attribute 'get'"
}
3. 客户端代码
client.py
import sys
from PyQt5.QtWidgets import (QApplication, QMainWindow, QWidget,
                           QVBoxLayout, QHBoxLayout, QPushButton,
                           QTextEdit, QLabel)
from PyQt5.QtWebEngineWidgets import QWebEngineView
from PyQt5.QtCore import QUrl
import requests
import json
import matplotlib.pyplot as plt
import matplotlib.image as mpimg
from matplotlib.patches import Polygon
import numpy as np
import cartopy.crs as ccrs
import cartopy.feature as cfeature
from matplotlib.colors import LogNorm

SERVER_URL = 'http://carl-shen.top:8848'

class PopulationQueryClient(QMainWindow):
    def __init__(self):
        super().__init__()
        self.init_ui()

    def init_ui(self):
        # 设置主窗口
        self.setWindowTitle('人口查询客户端')
        self.setGeometry(100, 100, 1200, 800)


        central_widget = QWidget()
        self.setCentralWidget(central_widget)
        main_layout = QVBoxLayout(central_widget)
        main_layout.setSpacing(10)  # 设置组件间距


        self.web_view = QWebEngineView()
        self.web_view.setUrl(QUrl('https://geojson.io'))
        # WebEngine会自动扩展填充可用空间
        main_layout.addWidget(self.web_view, stretch=1)


        bottom_container = QWidget()
        bottom_container.setFixedHeight(200)
        bottom_layout = QVBoxLayout(bottom_container)
        bottom_layout.setContentsMargins(0, 0, 0, 0)


        self.json_input = QTextEdit()
        self.json_input.setPlaceholderText('请在此粘贴上方生成的GeoJSON数据')
        self.json_input.setFixedHeight(100)
        bottom_layout.addWidget(self.json_input)


        result_button_layout = QHBoxLayout()


        self.result_label = QLabel('查询结果将在这里显示')
        self.result_label.setFixedHeight(50)
        result_button_layout.addWidget(self.result_label)


        submit_btn = QPushButton('提交查询')
        submit_btn.setFixedWidth(100)
        submit_btn.clicked.connect(self.submit_query)
        result_button_layout.addWidget(submit_btn)

        bottom_layout.addLayout(result_button_layout)

        main_layout.addWidget(bottom_container)

    def plot_query_area(self, coords: list, population: int, grid_data=None):
        # 计算边界范围
        coords_array = np.array(coords)
        minx, miny = np.min(coords_array, axis=0)
        maxx, maxy = np.max(coords_array, axis=0)

        dx = (maxx - minx)
        dy = (maxy - miny)

        # 根据实际比例计算figure size
        base_size = 12  # 基础尺寸
        if dx > dy:
            figsize = (base_size, base_size * (dy/dx))
        else:
            figsize = (base_size * (dx/dy), base_size)

        fig, ax = plt.subplots(
            figsize=figsize,
            subplot_kw={'projection': ccrs.PlateCarree()}
        )

        # 使用cartopy添加底图要素
        ax.add_feature(cfeature.LAND, color='lightgray', alpha=0.5)
        ax.add_feature(cfeature.OCEAN, color='lightblue', alpha=0.5)
        ax.add_feature(cfeature.BORDERS, linewidth=0.5)
        ax.add_feature(cfeature.COASTLINE, linewidth=0.5)

        if grid_data and 'grid_data' in grid_data:
            grid = np.array(grid_data['grid_data']['grid'])
            bounds = grid_data['grid_data']['bounds']

            # 使用bounds中的实际边界值创建网格
            x = np.linspace(bounds['minx'], bounds['maxx'], grid.shape[1])
            y = np.linspace(bounds['miny'], bounds['maxy'], grid.shape[0])
            xx, yy = np.meshgrid(x, y)

            grid = np.where(grid <= 0, np.nan, grid)
            # 为了更好的显示效果,将小于10的值设置为无
            grid = np.ma.masked_where(grid < 10, grid)

            # 绘制热力图
            pcm = ax.pcolormesh(
                xx, yy, grid,
                transform=ccrs.PlateCarree(),
                norm=LogNorm(vmin=1),
                cmap='YlOrRd',
                alpha=0.7,  # 添加透明度
                shading='auto'
            )
            plt.colorbar(pcm, ax=ax, label='Population')

        # 绘制查询区域边界
        polygon = plt.Polygon(
            coords,
            facecolor='none',
            edgecolor='red',
            linewidth=2,
            transform=ccrs.PlateCarree()
        )
        ax.add_patch(polygon)

        # 设置地图显示范围,使用grid_data中的bounds
        width = maxx - minx
        height = maxy - miny
        ax.set_extent([
            minx - width * 0.1,
            maxx + width * 0.1,
            miny - height * 0.1,
            maxy + height * 0.1
        ])

        gl = ax.gridlines(draw_labels=True, color='gray', linestyle='--', linewidth=0.5)
        gl.xlabel_style = {'size': 8}
        gl.ylabel_style = {'size': 8}

        plt.title(f'Population Distribution (Total: {population:,})')
        plt.show()

    def handle_geojson(self, json_str: str):
        try:
            if not json_str:
                self.result_label.setText("未获取到GeoJSON数据")
                return
            json_data = json.loads(json_str)

            # 只提取Polygon部分
            if 'type' in json_data and json_data['type'] == 'FeatureCollection':
                for feature in json_data['features']:
                    if feature['geometry']['type'] == 'Polygon':
                        polygon_data = {
                            'type': 'Polygon',
                            'coordinates': feature['geometry']['coordinates']
                        }
                        return polygon_data

            elif json_data['type'] == 'Polygon':
                return json_data

        except Exception as e:
            self.result_label.setText(f"解析错误: {str(e)}")

    def submit_query(self):
        json_text = self.json_input.toPlainText()
        json_data = self.handle_geojson(json_text)
        try:
            response = requests.post(
                SERVER_URL + '/query_population',
                json=json_data
            )

            if response.status_code == 200:
                result = response.json()
                if result['status'] == 'success':
                    self.result_label.setText(
                        f"总人口数: {result['total_population']}\n"
                    )
                    # 绘制
                    self.plot_query_area(
                        json_data['coordinates'][0],
                        result['total_population'],
                        result
                    )
                else:
                    self.result_label.setText(f"查询失败: {result['message']}")
            else:
                self.result_label.setText(f"错误: {response.status_code}")

        except Exception as e:
            self.result_label.setText(f"错误: {str(e)}")


def main():
    app = QApplication(sys.argv)
    client = PopulationQueryClient()
    client.show()
    sys.exit(app.exec_())

if __name__ == '__main__':
    main()
3.1 代码说明
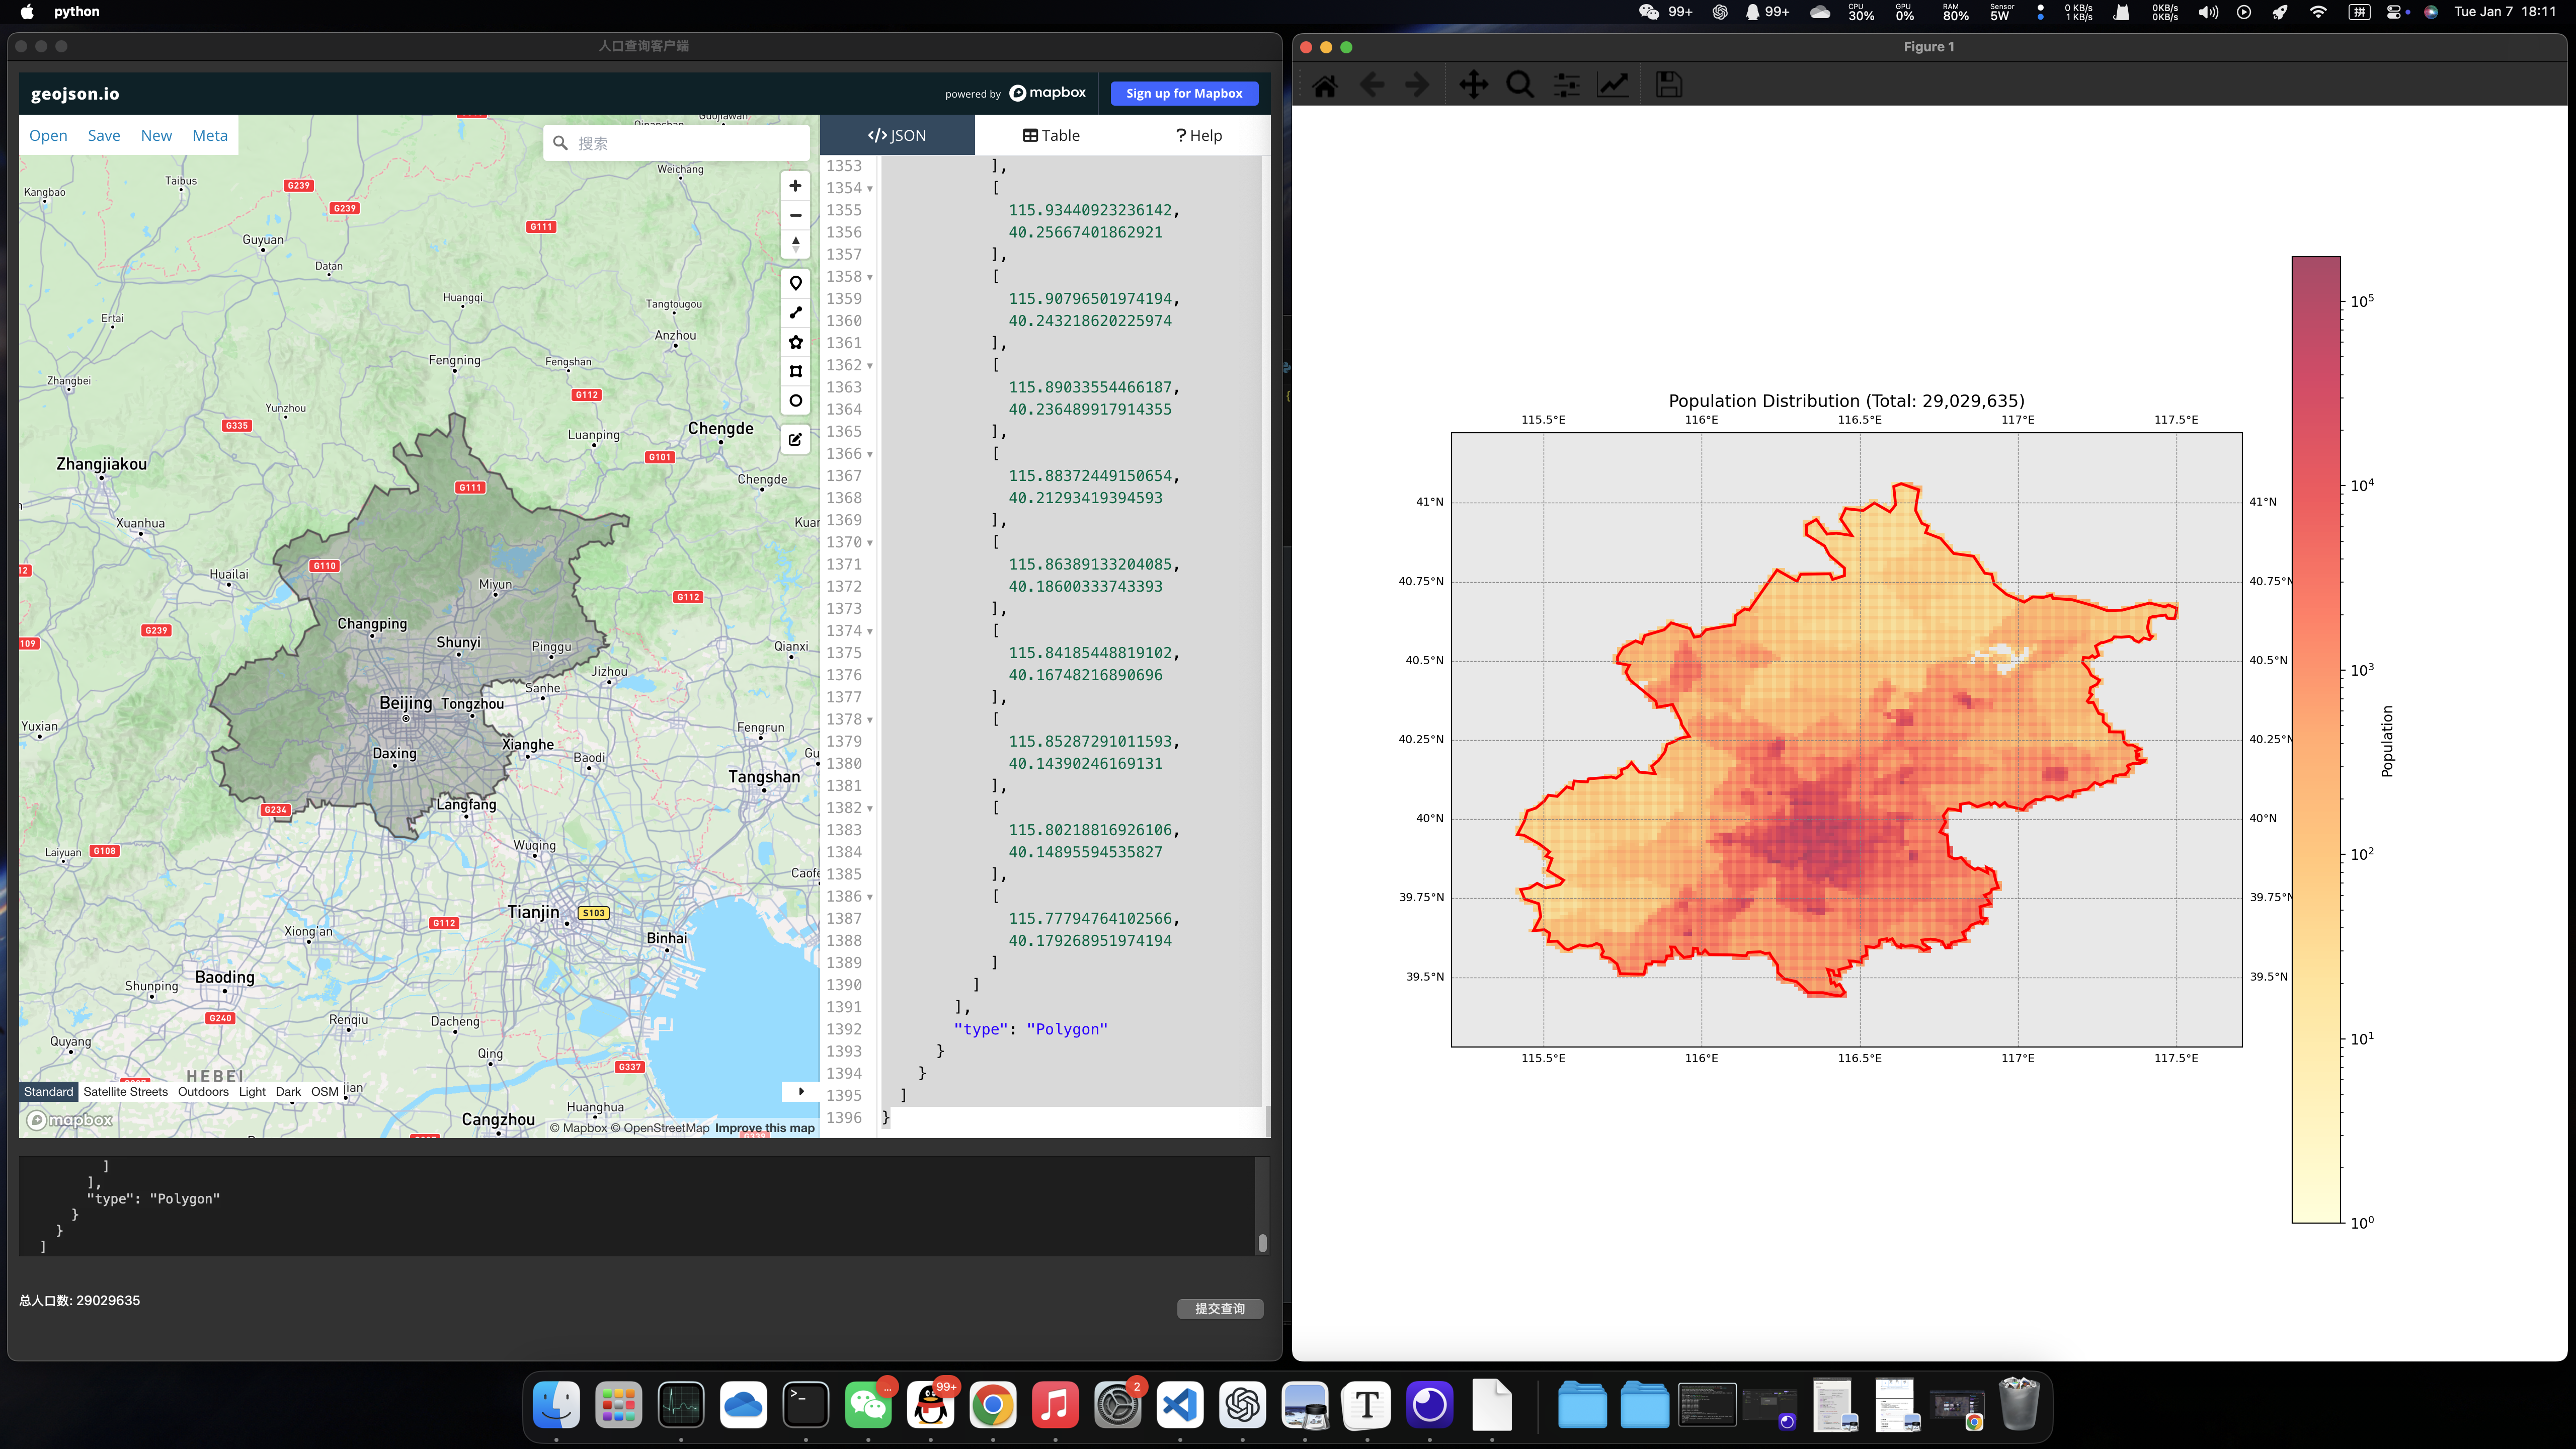
GUI客户端基于PyQt框架进行搭建,使用QtWebEngine组件挂载了geojson.io网站便于用户生成所需的GeoJSON格式,界面效果如下图所示:

用户可以在WebEngine组件中绘制多边形,右侧会自动生成相应的GeoJSON数据,将数据全选粘贴到下方的文本框中,点击提交查询即可获取目标多边形的人口分布数据。
示例1:北京市
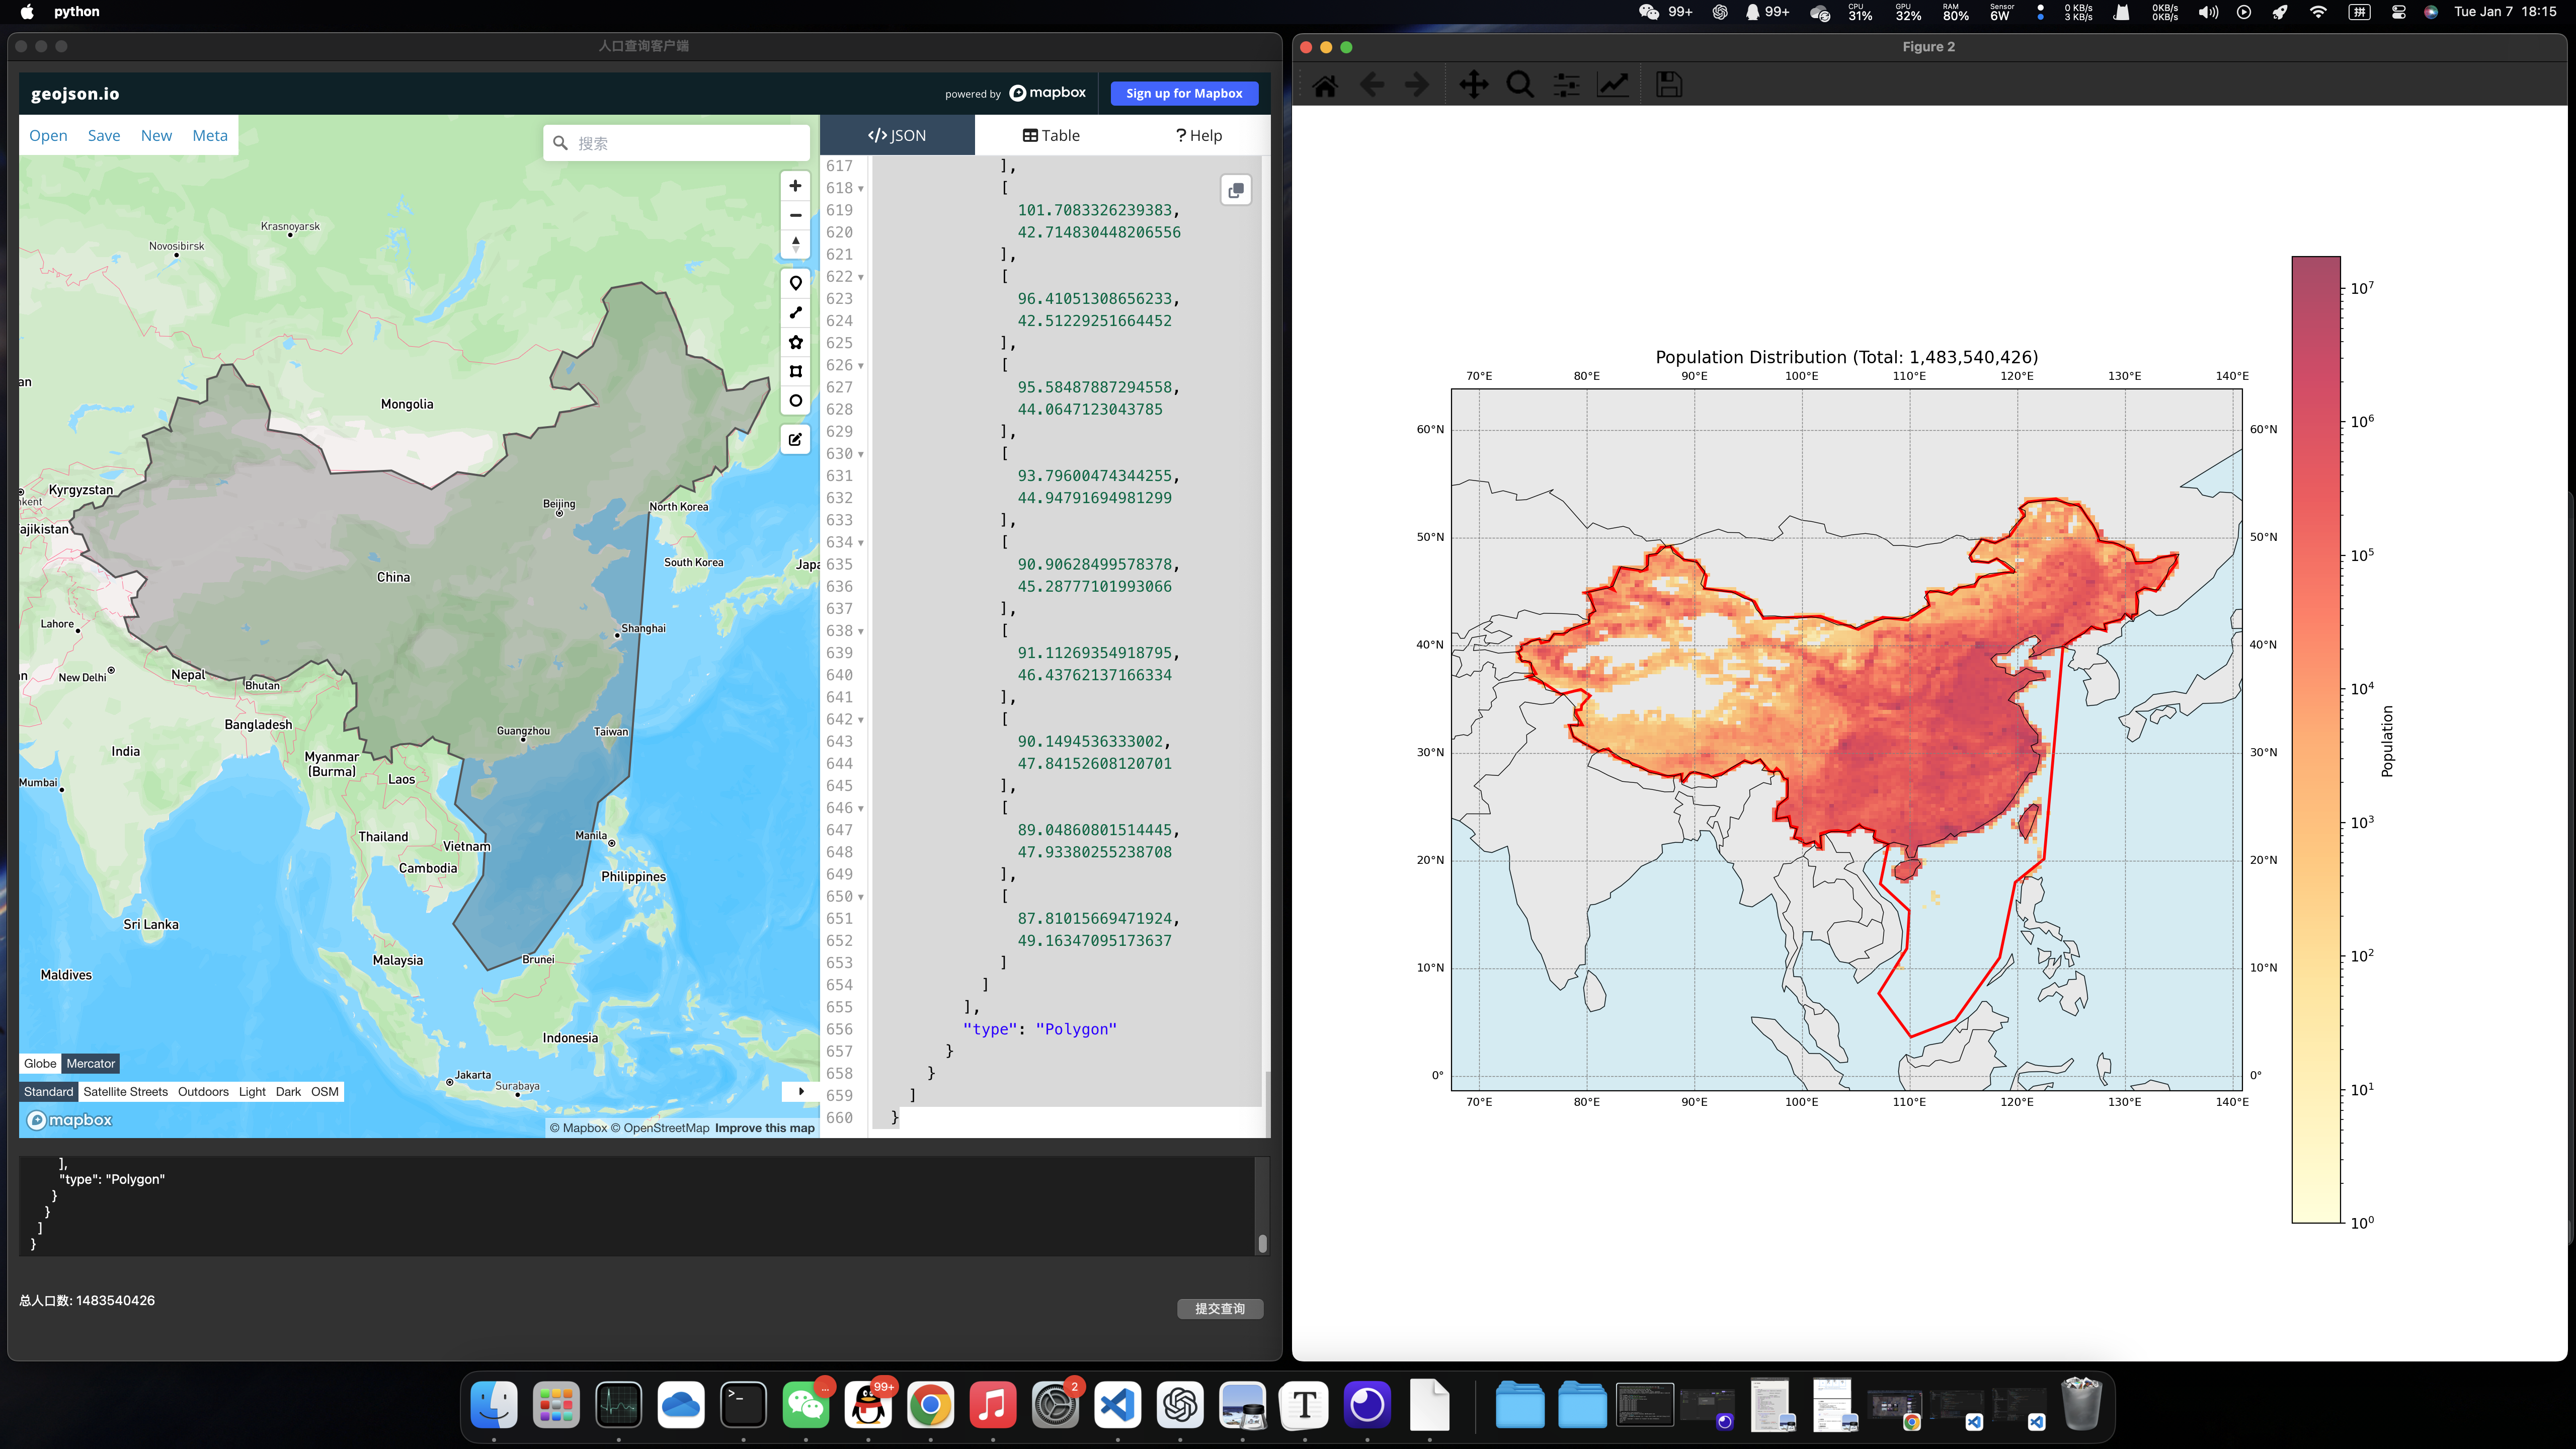
示例2:中国
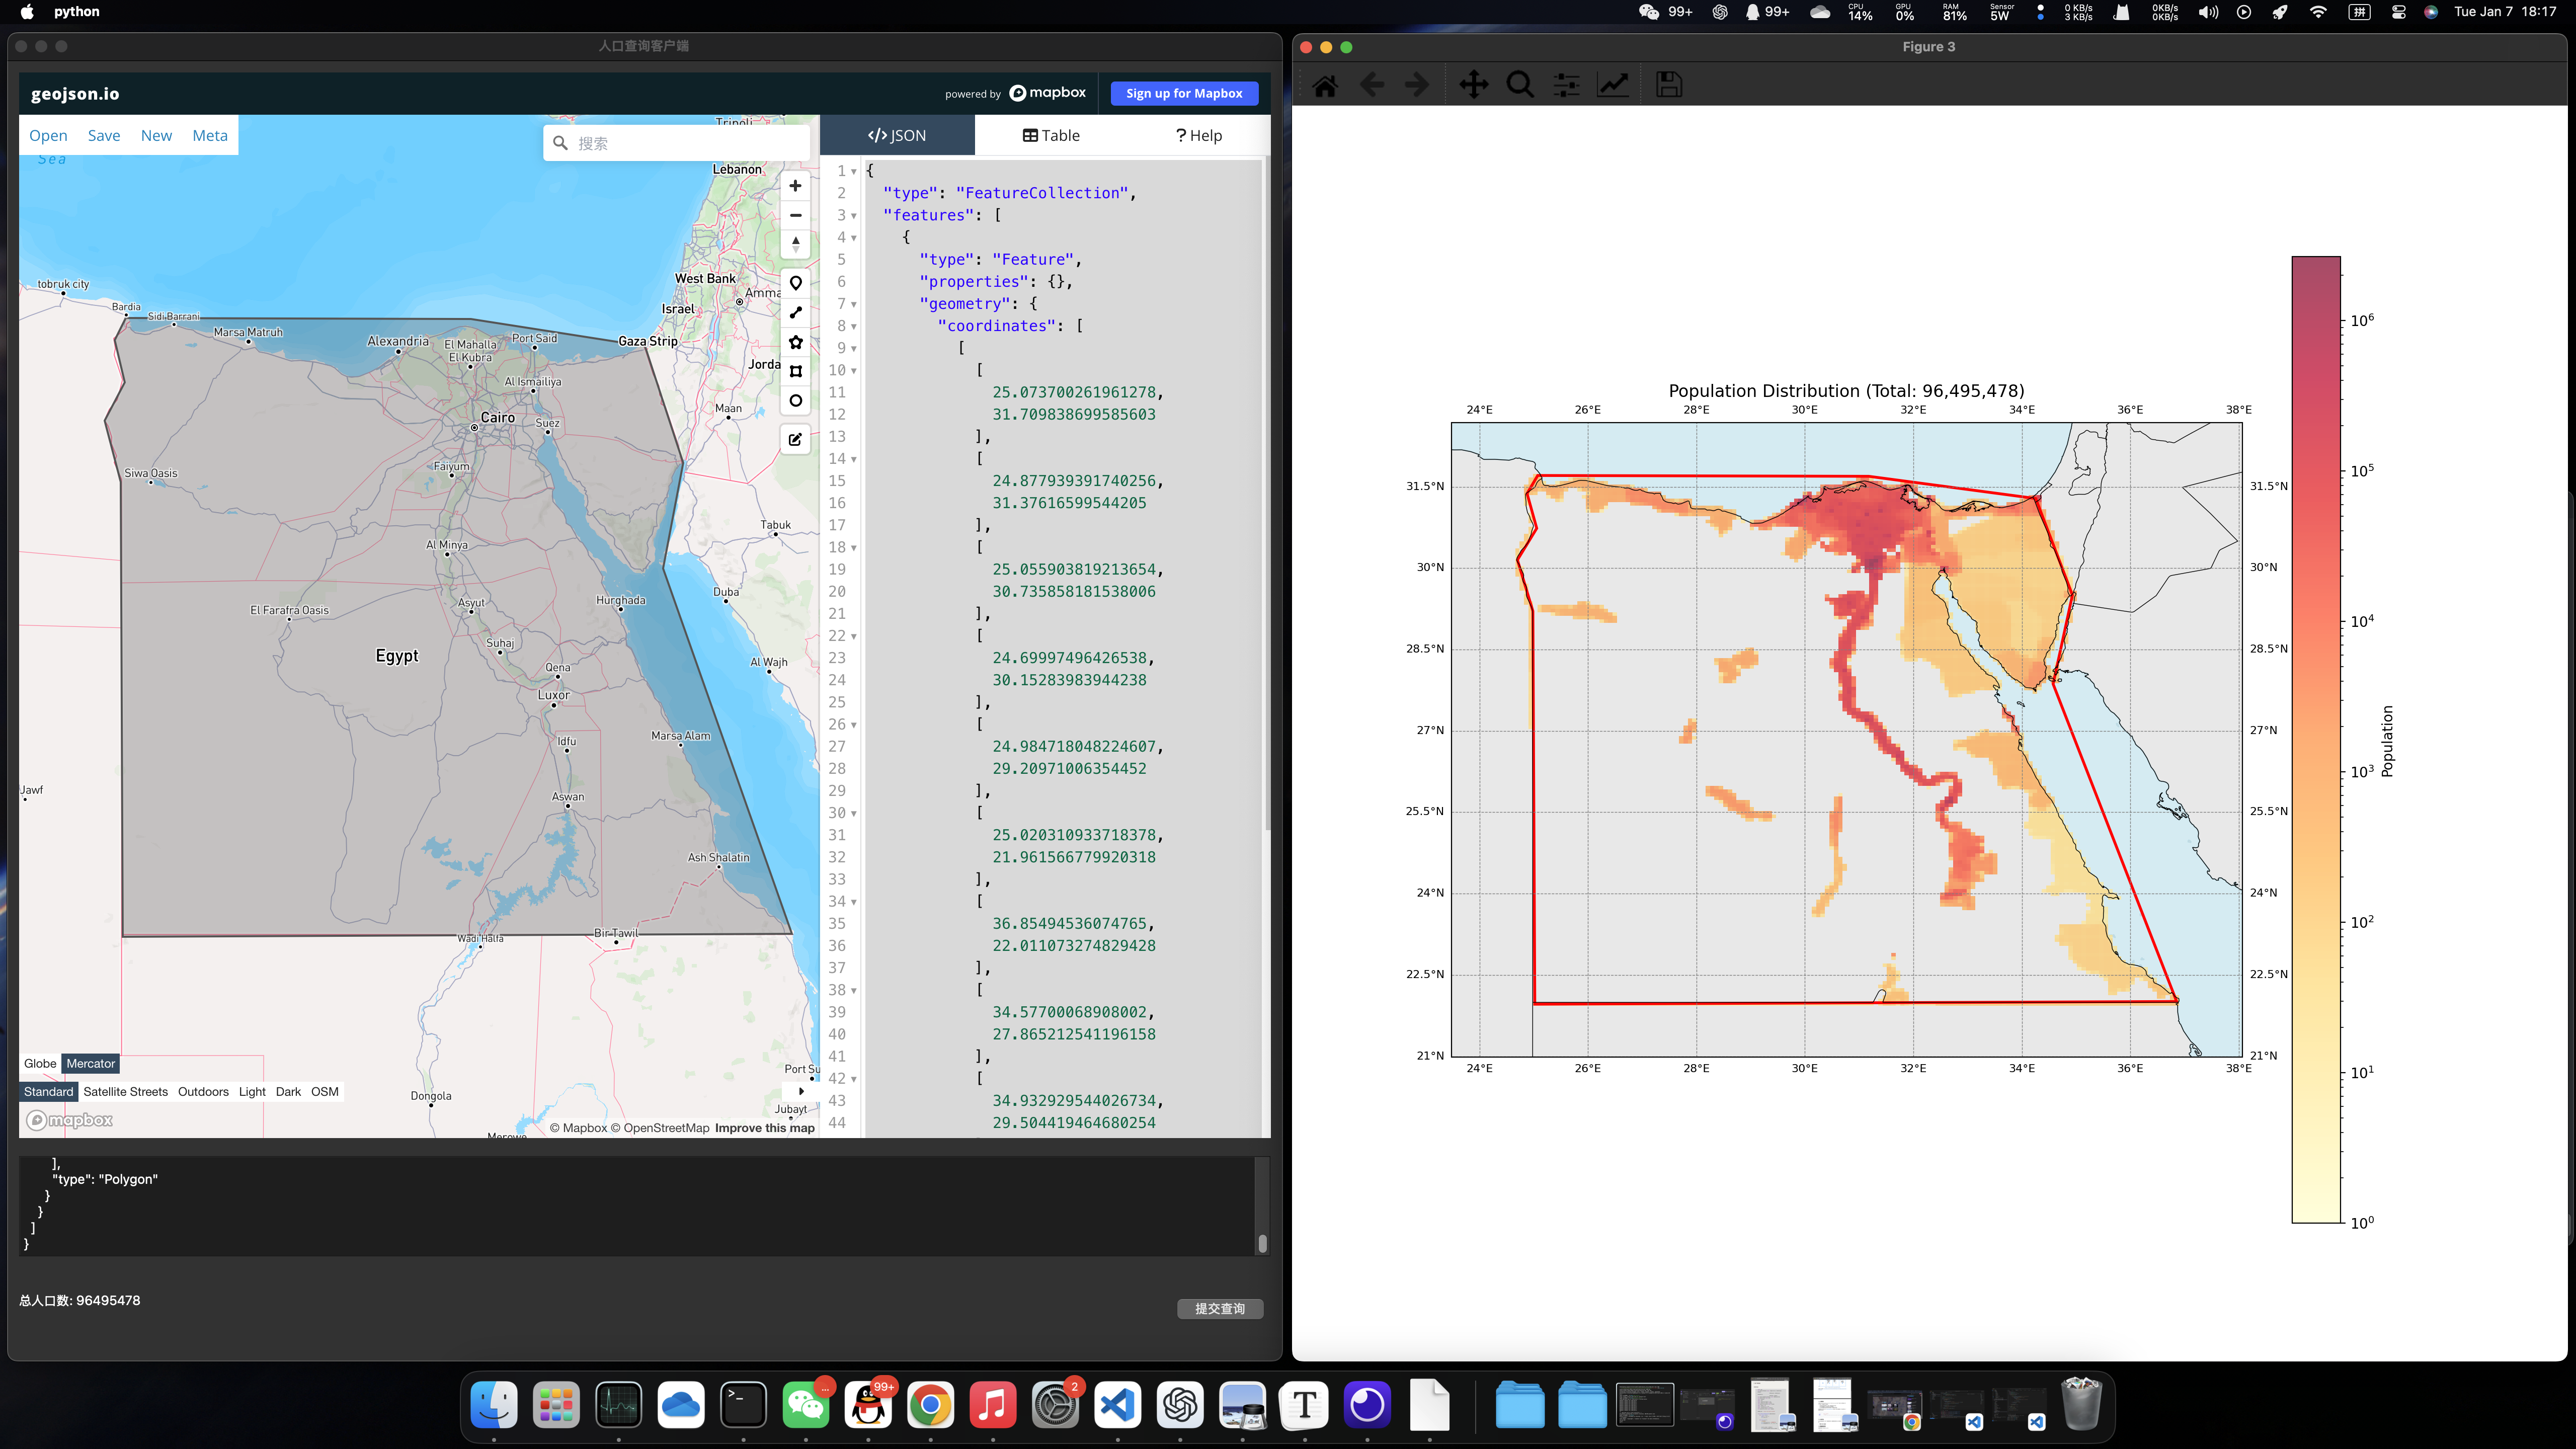
示例3:埃及 (选择埃及是由于埃及的人口分布特征鲜明,大部分分布在尼罗河沿岸,其余国土并不宜居)
3.1.1 窗口布局
在 PopulationQueryClient 类中,我使用了 PyQt5 的布局管理器来组织窗口中的各个组件。主窗口使用 QVBoxLayout 布局,将组件从上到下排列。顶部是一个 QWebEngineView 组件,用于显示 geojson.io 网页,并设置 stretch 参数为1,使其在窗口大小调整时自动扩展。底部是一个固定高度的容器,使用 QVBoxLayout 布局,包含一个用于输入GeoJSON数据的 QTextEdit 输入框、一个用于显示查询结果的 QLabel 标签和一个提交查询的 QPushButton 按钮。输入框和标签分别设置了固定高度,按钮设置了固定宽度,并通过 QHBoxLayout 水平排列在底部容器中。
3.1.2 用户输入处理
handle_geojson方法用于处理用户在文本框粘贴的GeoJSON数据。由于 geojson.io 网站生成的JSON是一个'FeatureCollection',而我需要提供给后端的仅有多边形部分,所以这个方法会将JSON数据中type字段为Polygon的部分提取出并返回。
3.1.3 服务端交互
submit_query方法从输入框获取GeoJSON数据并解析为Python字典,然后向后端服务器发送POST请求进行人口查询。收到响应后,方法检查响应状态码,如果查询成功,则在结果标签中显示总人口数,并调用 plot_query_area方法绘制查询区域和人口分布热力图;如果查询失败,则在结果标签中显示错误信息。
3.1.4 图形绘制
从后端获取的人口分布数据会被提供给plot_query_area方法,这个方法会首先基于cartopy库绘制一个矢量世界地图作为图像的底图。然后根据人口分布数据创建经纬度网格,并对数据做对数归一化处理,使用 pcolormesh 方法绘制热力图,同时添加颜色条。接着绘制查询区域的多边形边界,并设置地图显示范围和网格线。最后在标题显示总人口数,并显示绘制的图形。